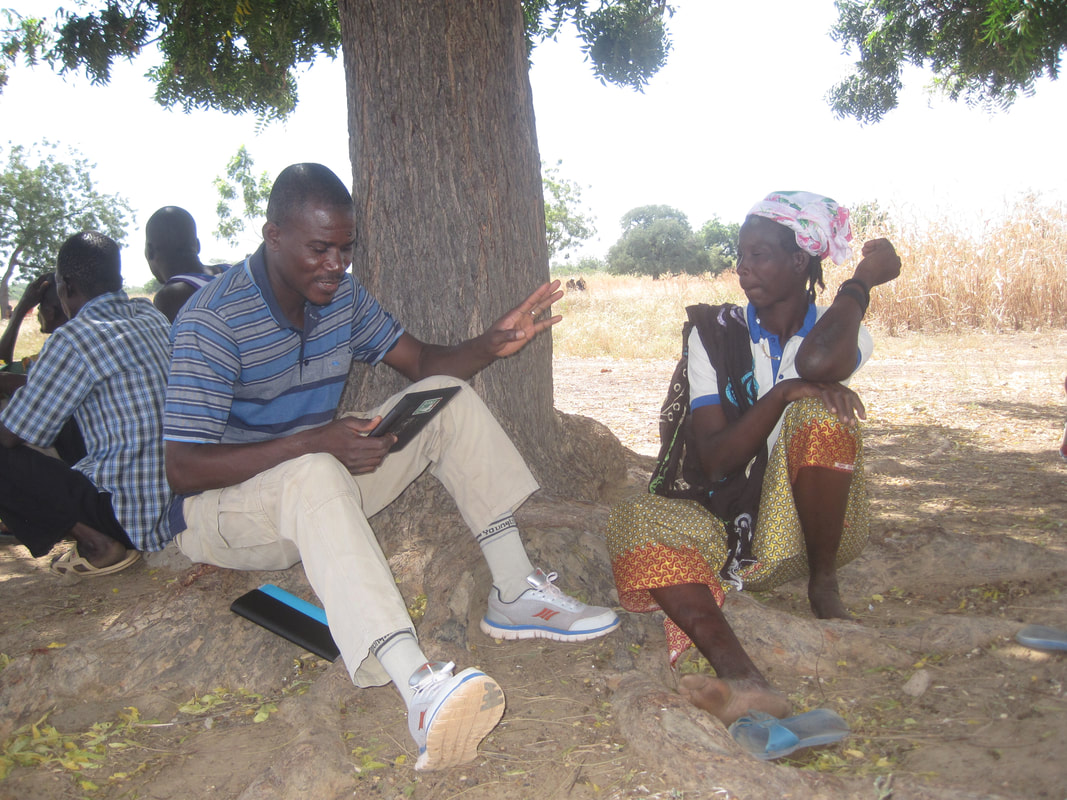
Editor: The NGO TREE AID have been using the RHoMIS tool for almost three years, with over twelve implementations of the survey. We have provided a customised questionnaire and data analysis code to support their excellent work. Following on from their recent blog article ‘Using Technology to maximise our impact’, we interviewed David Baines, their Monitoring, Evaluation & Learning (MEL) Advisor. The interview below helps us to understand a bit more about how RHoMIS is used and the impact we have had on international development. Sam (RHoMIS): Hi David. Thanks for joining me today. First, can you tell me a bit about TREE AID and your role? David (TREE AID): Hi Sam. I am the Monitoring, Evaluation and Learning Advisor at TREE AID, which means I help our project managers and teams collect data which can be analysed to illustrate change, impact and learning. We work with local communities in the drylands of Africa to help them protect and grow trees. We currently work in Ethiopia and across four countries in West Africa – Mali, Burkina Faso, Ghana, and Niger – and have an office in Bristol, UK. Sam: Please can you tell me a bit about how you use RHoMIS for your work? David: We use RHoMIS to get baseline data for our projects. We repeat the same questionnaires for the endline surveys, which allows us to compare indicators and measure our impact. RHoMIS has helped us to migrate to digital data collection, where we now use ODK for all our surveys, including other monitoring (non-RHoMIS) surveys. Sam: What were you using before RHoMIS? David: We were paper based and our M&E was done on a project-by-project basis. There was no consistency or comparability between projects, and the data quality was low. Sam: Can you tell me a bit about what you can do now that you use RHoMIS that you could not do before? What were some of the reasons you chose to use RHoMIS? David: We can do a lot more with our M&E now. We can now compare responses between projects, for example, measuring income across projects and across countries so we can identify patterns and broader impact. We can also plot geographically where interviews have taken place. This will be helpful in future surveys as it allows us to return to the same household, as we have the GPS coordinates. We are now sampling in a much more scientific manner and can explain our sampling rationale. We can stratify our sample groups to make sure they represent the different groups within a project which we are interested in tracking. And we can produce infographics and visualisations such as mapping and data graphs. RHoMIS was chosen because it is reasonably quick and because of the ready-to-use modules and questions. We also chose RHoMIS because it distils socio-economic research into established interview questions, such as HFIAS and HDDS. This allows us to track our work with internationally recognised indicators, and include that information whenever we talk about our work.
Sam: And may I ask what are some of the challenging aspects of using RHoMIS? David: There is almost too much data! We are currently only using half of the 100 headline indicators from RHoMIS. We have conducted almost 5,000 surveys. It is challenging to integrate the data across the projects. We are continually improving our data management. Sam: Thanks for your honest feedback David. I want to ask now about how RHoMIS has helped you as an organisation to better understand the impact of your work. Have you gained any new insights because of the data collected with RHoMIS? David: Yes, we have gained new insights. For example, using the RHoMIS HFIAS module [Household Food Insecurity Access Scale] we have learnt that our beneficiaries are less food insecure, compared with the control group of non-beneficiaries. Likewise, we see that our beneficiaries have an average of 40% higher income than non-beneficiaries. This helps us measure how our work is helping these households. As a major focus of our work is supporting households to benefit from NTFPs (non-timber forest products), we have been pleased to see that our beneficiaries source on average 15% of their total income from NTFPs, compared to 12% amongst non-beneficiaries. We also focus on gender equality. The RHoMIS Voice Choice Control module has taught us that of the female beneficiaries, 39% answer that they have ‘equal to moderate control over household assets’. This compares to 33% amongst the control group.
David: The results from previous surveys are used in all of our project reports, both internally and to donors. We also use the data to submit new proposals and funding bids. By including RHoMIS-generated data, we have been successful in getting funding for new projects in Ghana and Mali. Because of RHoMIS we are able to make strong statements, supported by our data, in these proposals.
Within our management of the projects, the RHoMIS data has shown us inconsistencies in our results, highlighting where we need more understanding. For example, sometimes there are inconsistent reports of income at household level compared to the enterprise groups that we work with. Sam: I see you are using RHoMIS data extensively with your project monitoring and evaluation. Finally, what are your plans for RHoMIS usage in the future? David: We will be conducting a RHoMIS survey for baseline and endline in all our major projects. That’s a minimum of four RHoMIS surveys a year. This year we will be conducting our first endline, which will allow us to compare the data with the RHoMIS baseline from 2017. Sam: I’m pleased to hear we will continue working together. Well, David, that’s the end of our interview. Thank you so much for your time and I wish our continued partnership every success. David: Thank you Sam.
1 Comment
|
RHoMIS BlogThe RHoMIS blog is written by a community of practice. The COP is made up of RHoMIS users and creators from across the world. Here we share their stories of how RHoMIS is helping to record and analyse household data. Archives
May 2020
Categories
All
|
 RSS Feed